
Breaking Down the Basics: How to Read a Stock Chart for Beginners
- Marcus Kuhnert
- Sep 10, 2025
- 2 min read
A practical, educational piece aimed at novice investors showing them how to understand trends, volume, and key indicators.

For beginners, reading a stock chart can seem like decoding a complex puzzle. However, understanding the basics of stock charts can provide valuable insights into market trends and help you make informed investment decisions. Here’s a quick guide on how to read a stock chart, focusing on trends, volume, and key indicators.
1. Trends
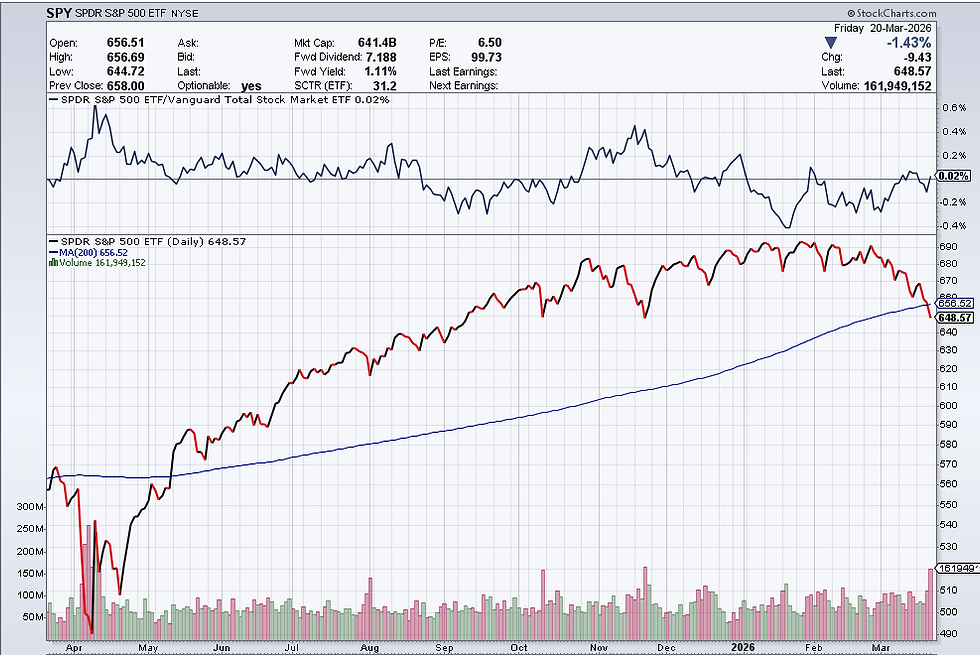
The first step in reading a stock chart is to identify the overall trend. Trends show the general direction the stock price is moving. There are three primary trends:
Uptrend: When the stock price consistently makes higher highs and higher lows. This indicates that the stock is gaining value.
Downtrend: When the stock price consistently makes lower highs and lower lows. This indicates that the stock is losing value.
Sideways/Horizontal Trend: When the stock price moves within a narrow range. This indicates a period of consolidation.
2. Volume
Volume represents the number of shares traded during a specific period. It is usually displayed as vertical bars at the bottom of a stock chart. High volume often indicates strong investor interest and can signal the strength of a price movement. For example, a price increase on high volume suggests a strong uptrend, while a price drop on high volume indicates a strong downtrend.
3. Key Indicators
Key indicators help you analyze stock price movements and predict future trends. Some essential indicators include:
Moving Averages (MA): These smooth out price data to identify the direction of the trend. Common types are the 50-day MA and the 200-day MA.
Relative Strength Index (RSI): This momentum oscillator measures the speed and change of price movements. An RSI above 70 suggests the stock is overbought, while an RSI below 30 suggests it is oversold.
MACD (Moving Average Convergence Divergence): This indicator shows the relationship between two moving averages and helps identify buy or sell signals.
Conclusion
By understanding trends, volume, and key indicators, beginners can start to make sense of stock charts. Use these elements to analyze stock performance and make more informed investment decisions. With practice and continual learning, reading stock charts will become an invaluable tool in your investing toolkit.


Comments